Emilia Chojkiewicz 1, 2, Nikit Abhyankar 1,*, Amol Phadke 1
1 IECC, Goldman School of Public Policy, University of California Berkeley
2 Energy and Resources Group, University of California, Berkeley
* Corresponding author – email
Plummeting costs of solar and battery storage in India along with technological improvements are opening new opportunities for clean and low-cost power generation. Recent energy storage auctions in India reveal record-low prices, with unsubsidized standalone battery storage bids at 2.8 lacs/MW/month and solar+storage bids at 3.1–3.5 INR/kWh
Our analysis, based on implied solar and storage costs from these bids and bottom-up global cost estimates, shows that a solar-plus-storage system can deliver 24/7 clean power at over 95% availability for less than 6 INR/kWh.

Costs of a solar+storage flat block are projected to remain constant through 2040 in nominal terms, whereas national electricity prices for industrial consumers are likely to increase based on historical trends (Kareer, 2024). A solar+storage flat block is also competitive with industrial electricity prices in several major Indian states, which have exhibited significant variability over the past fifteen years.

Co-location of storage, along with declines in battery capex – i.e., pack prices as well as Balance of System (BoS) costs – and simultaneous cycle life improvements have dramatically lowered the LCOS between 2020 and 2025, with additional improvements forecast to 2030 (based on global pack prices from BNEF, 2024 as well as BoS costs from NREL, 2024).
This cost is comparable to or lower than current industrial tariffs in most states and tariffs for new coal power plants. Unlike industrial tariffs, which typically increase with inflation, solar-plus-storage tariffs will remain fixed and inflation-proof for 25 years.
These trends have profound implications, providing a cost-effective alternative for industrial consumers and utilities and challenging the economic viability of new thermal power plants.
Over the past several years, the costs of clean energy technology have declined significantly. Take the example of solar photovoltaic (PV) power: module prices have plummeted, from about $2.4/watt in 2010 to around 10 cents/watt in 2024 as seen in Figure 1 (IRENA et al., 2024). This is key, since modules are typically the largest single cost in solar PV systems. Simultaneously, the global manufacturing capacity of solar PV modules is currently twice that of demand, leading to a large supply glut; in fact, we have more solar PV manufacturing capacity than is needed to be on track for net zero (IEA, 2024a; IEA, 2024b). Such ubiquitous low-cost solar has enabled large-scale deployment around the globe, including India. As a result of supportive and innovative policies coupled with the solar cost declines, India boasts the lowest capital costs of solar ($425.3/kW or 3.5 Rs Cr/MW quoted by BNEF but reported down to $350/kW or 2.9 Rs Cr/MW for commercial developers as of early 2025) as well as the lowest levelized cost of electricity (LCOE) of solar (at $31.9/MWh or Rs 2.5/kWh) among all major global economies (Narang et al., 2024).

Figure 1. Global prices of solar photovoltaic modules have declined to under 9 INR/watt (0.1 USD/watt); simultaneously, global solar PV module production capacity has grown exponentially in recent years to reach 1150 GW at the end of 2023, with additional expansion to 1600 GW planned by 2030 (data from IRENA et al., 2024; IEA, 2024a; and market sources).
In addition to the progress in solar power, energy storage in batteries has come a long way as well. The costs of lithium-ion battery pack prices have come down dramatically in the past few years, from approximately 13860 INR/kWh (165 USD/kWh) in 2020 to 8388 INR/kWh (100 USD/kWh) in 2025 on a global basis for all chemistries. Further, the cost differential between regions has narrowed significantly, implying that low-cost storage is available globally (BNEF, 2024). Simultaneously, cycle life has improved from approximately 2,000 cycles in 2018 to Chinese battery-maker CATL claiming their cells can now last over 10,000 and up to 15,000 cycles without degradation (Zhang, 2024). As seen in Figure 2, these declines in battery capital costs as well as improvements in battery cycle life have dramatically lowered the Levelized Cost of Storage (LCOS). Additional improvements in energy density as well as the reduced intensity of critical minerals (i.e., nickel and cobalt) has further acted to improve battery technology and lower costs. And if all new battery production is realized, we will similarly have more battery production capacity than is needed for net zero (IEA, 2024b). Together, these developments open up new opportunities for the use of solar and storage to provide low-cost clean power.
Figure 2. Co-location of storage, along with declines in battery capex – i.e., pack prices as well as Balance of System (BoS) costs – and simultaneous cycle life improvements have dramatically lowered the LCOS between 2020 and 2025, with additional improvements forecast to 2030 (based on global pack prices from BNEF, 2024 as well as BoS costs from NREL, 2024). Assumes an opex of 101 INR/kWh/yr, real WACC of 10%, 25 year project life, a consistent 350 cycles/year, 90% depth of discharge, and 85% round trip efficiency. 2020 & 2025 include pack replacement. Assumes an exchange rate of 84 INR=1 USD. Assumes conservative cycle life & global pack costs, although Chinese battery maker CATL announced in July 2024 a commercially-available lithium ion battery with a cycle life of up to 15,000 cycles (Ridden, 2024).
These dramatic cost declines and technological improvements are reflected in the latest market developments in India. Specifically, recent auction results for storage have been record-breaking: the latest tender for standalone battery energy storage systems (BESS) with two hours’ duration in April 2025 saw a winning bid of 2.8-2.85 lacs/MW/month, without any subsidy like the Viability Gap Funding (VGF). This is approximately 20% lower than the two tenders held in the second half of 2024, where winning bids ranged from ₹3.0 to ₹3.2 lakh/MW-month; after accounting for the 30% VGF support, the effective auction price was ₹2.2–2.3 lakh/MW-month. Meanwhile solar + storage systems with two to four hours’ duration have seen winning bids of 3.1-3.5 INR/kWh. As seen in Figure 3, these costs have come down over 50-60% over the past 18 months, reflecting a tremendous drop from November 2023 to April 2025.
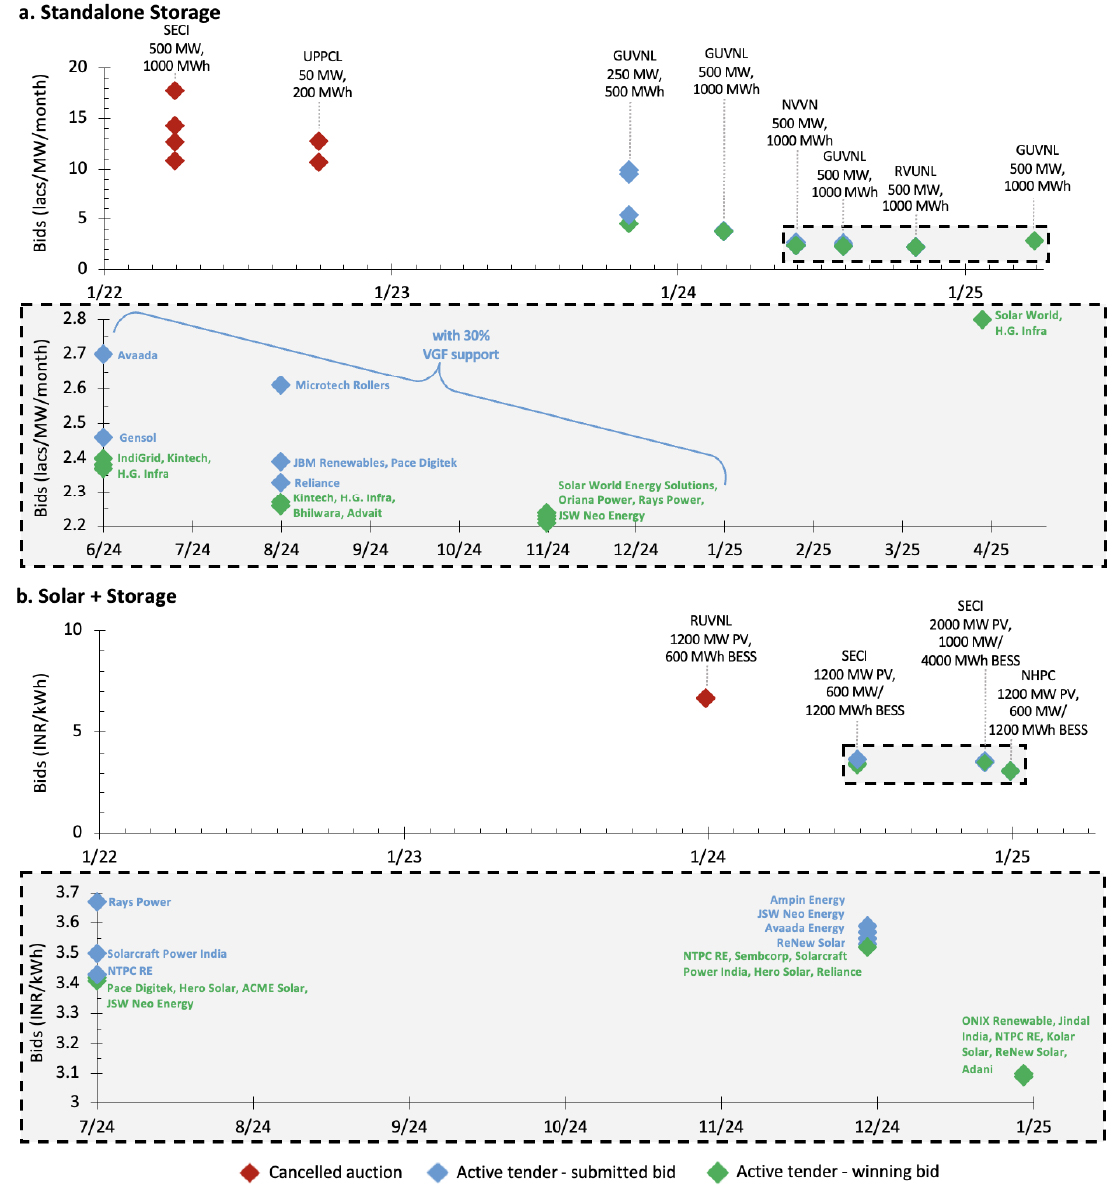
Figure 3. Not only have storage prices declined dramatically over the past year for both (a) standalone storage and (b) solar + storage, but the spreads between the bids in each tender have also substantially narrowed. Note: figure updated as of January 2025. The bids of standalone BESS tenders from June 2024 onwards include a 30% “Viability Gap Funding” (VGF) subsidy. Shows at most the 5 least-cost distinct bids for each tender.
In Figure 4, we reverse engineer the latest winning bids to estimate the battery capital costs. This includes the costs of individual components, namely the battery pack, pack replacement, the Electrical and Structural BOS (Balance of System), and the EPC (Engineering, Procurement and Construction). This backcalculation indicates that, as of April 2025, pack prices available to Indian project developers have reached levels near 60 USD/kWh.

Figure 4. Battery capital costs, by component, are reverse engineered from recent winning bids and other market data. Assumes an opex of 101 INR/kWh/yr, real WACC of 10%, and 85% round trip efficiency. Assumes a 12-year project life and 95% availability for standalone; and a 25-year project life and 100% availability for co-located solar+storage. Pack replacement refers to the discounted net present value (NPV) of a pack replacement in the 12th year (~2039) for co-located systems. Assumes an exchange rate of 84 INR=1 USD.
Breaking down these auction results reveals additional insights. First, consider the latest solar+storage auction results as seen in Table 1. These bids include not only storage costs but solar costs as well; the solar Levelized Cost of Electricity (LCOE) is likely around 2.3-2.5 INR/kWh, reflecting the latest solar costs in India, comprising the majority of the winning bids. The remaining 1-1.5 INR/kWh in the SECI auction as well as the 0.6-1 INR/kWh in the NHPC auction reflect the storage component, referred to as the “storage adder”. As seen in the build-up in Figure 4, this also allows us to reverse engineer the implied battery capex, which comes out to 114-126 USD/kWh for these two latest co-located solar+storage auctions. As shown in Table 1, the estimated non-solar hour cost is ₹5.1–6.3/kWh, assuming a solar hour cost of ₹2.3–2.5/kWh and a typical DC solar capacity factor of 20%. This implies that the SECI project (2000 MW solar PV + 1000 MW/4000 MWh BESS), requires storing approximately 40% of daily DC solar generation, while the NHPC project (1200 MW solar PV + 600 MW/1200 MWh BESS), requires about 20%
Table 1. Estimating a flat block storage adder based on the latest solar+storage auction results.
| Auction info | Winning Bid | Bid breakdown | % energy stored in batteries | Non-solar hour cost 2 | Implied co-located battery capex 2 | Co-located flat block storage adder 3 |
12/2024 SECI auction for 2000 MW PV, 1000 MW/4000 MWh BESS | 3.52 INR/kWh | 2.3-2.5 INR/kWh solar LCOE 1 | 40% DC solar energy stored in batteries | 5.1 -5.4INR/kWh | ~114 USD/kWh | 1.5 INR/kWh |
| 1-1.2 INR/kWh storage adder | ||||||
1/2024 NHPC auction for 1200 MW PV, 600 MW/1200 MWh BESS | 3.09 INR/kWh | 2.3-2.5 INR/kWh solar LCOE 1 | 20% DC solar energy stored in batteries | 5.5-6.3 INR/kWh | ~126 USD/kWh | 1.8 INR/kWh |
| 0.6-0.8 INR/kWh storage adder |
1 Reflects the latest solar LCOE data from India.
2 Assumes an opex of 101 INR/kWh/yr, real WACC of 10%, 85% round trip efficiency, and 100% availability. Assumes a 25-year project life for co-located solar+storage. Pack replacement refers to the discounted net present value (NPV) of a pack replacement in the 12th year (~2039) for co-located systems. Battery capex includes EPC (Engineering, Procurement and Construction), the Electrical and Structural BOS (Balance of System), pack replacement, and pack cost. Opex does not include charging costs. Assumes an exchange rate of 84 INR=1 USD.
3 Assumes a flat block requires ~60% of daily DC solar energy to be stored in batteries.
Given the falling costs of battery storage, could solar+storage provide a flat block – i.e., a continuous 24/7 – supply of power? We break this down in Figure 5, taking the 12/2024 SECI project for 2000 MW PV, 1000 MW/4000 MWh BESS as a stylistic example. Figure 5a shows the project operating per its designed specifications: approximately 10,000 MWh of solar is discharged directly to the grid, while the 4-hr storage system discharges its 4,000 MWh of stored energy at its rated capacity of 1000 MW to support morning and evening peaks. However, as shown in Figure 5b, the project can also be operated differently, to discharge the 4,000 MWh that is stored each day over all non-solar hours; i.e., the storage is discharged at 325 MW over 12 hours, providing round-the-clock clean electricity. In Figure 5c, we show how the 1000 MW/4000 MWh BESS with only approximately 1200 MW AC of solar PV could support a flat block load of approximately 325 MW round-the-clock.

Figure 5. Stylistic example of deriving the flat block storage adder from the SECI 2000 MW PV, 1000 MW/4000 MWh BESS project, showing (a) project operating per design specifications, (b) project discharging at derated capacity over non-solar hours, (c) project operating as a flat block, serving a continuous 24/7 load.
Compared with Figure 5b, the scenario shown in Figure 5c demonstrates that a flat block of power requires ~60% of DC solar energy to be stored in storage daily. Intuitively, increasing the desired duration of storage discharge requires more storage, with a larger percentage of the daily solar generation being stored in storage. In contrast, the 4-hr duration SECI project requires ~40% of daily DC solar energy generation to be stored (storage adder of Rs 1/kWh), while the 2-hr duration NHPC project requires only ~20% of daily DC solar energy to be stored (storage adder of Rs 0.6/kWh). Therefore, flat-block storage adder is estimated to be approximately ~1.5 times the SECI storage adder and ~3 times the NHPC storage adder, or 1.5-1.8 INR/kWh. This implies that solar + storage 24×7 flat-block of power could be available at Rs 4.0-4.3/kWh (Rs 2.5/kWh of solar + Rs 1.5-1.8/kWh of storage adder) based on existing auction results in India.
We next corroborate these results using the latest standalone storage auction results as seen in Table 2. From the winning bids in lacs/MW/month, we estimate the implied storage cost on a INR/kWh basis based on the project parameters, removing the ~30% Viability Gap Funding (VGF) subsidy for standalone storage, and dependent on the number of cycles per day (one or two). We see that the delivered price of peak power from renewables plus storage is about 6.5 INR/kWh for a single cycle and a little over 3 INR/kWh for two cycles/day. This is significantly lower than the prices on the India power exchange (IEX), which in comparison, averaged in the low 3 INR/kWh in peak solar hours and over twice that in non solar hours in 2024. Similarly as in the solar+storage auction results, we can estimate the implied standalone battery capex and the standalone flat block storage adder. We get similar results for the flat-block storage adder of approximately Rs 2.1/kWh – implying solar + storage flat block could be achieved under Rs 4.6/kWh (Rs 2.5/kWh for solar + Rs 2.1/kWH for storage), based on existing auction results. We also see that the costs tend to be higher on a per-kWh basis for standalone systems rather than co-located, hybrid solar+storage systems: the implied standalone battery capex is approximately 15% higher than the capex of batteries co-located with solar. This is in part because co-location of batteries with solar offers significant savings on the Balance of System (BOS) costs.
Table 2. Estimating a flat block storage adder based on the latest standalone storage auction results.
| Auction info | Winning Bid | Implied storage cost 1 | Implied standalone battery capex 2 | Standalone flat block storage adder |
| 8/2024 GUVNL auction for 500 MW/1000 MWh BESS | 2.26 lacs/MW/month (incl 30% VGF) 3.23 lacs/MW/month (without VGF) | 6.7 INR/kWh (single cycle) | ~140 USD/kWh | 2.1 INR/kWh |
| 3.3 INR/kWh (double cycle) | ||||
| 11/2024 RVUNL auction for 500 MW/1000 MWh BESS | 2.21 lacs/MW/month (incl 30% VGF) 3.16 lacs/MW/month (without VGF) | 6.5 INR/kWh (single cycle) | ~140 USD/kWh | 2.1 INR/kWh |
| 3.3 INR/kWh (double cycle) |
1 Without the 30% Viability Gap Funding (VGF) subsidy for standalone storage and assuming 85% round trip efficiency and 95% availability.
2 Assumes an opex of 101 INR/kWh/yr, real WACC of 10%, 85% round trip efficiency, and 95% availability. Assumes a 12-year project life for standalone. Battery capex includes EPC (Engineering, Procurement and Construction), the Electrical and Structural BOS (Balance of System), pack replacement, and pack cost. Opex does not include charging costs. Assumes an exchange rate of 84 INR =1 USD.
These storage costs imply that Indian developers are accessing battery packs at prices below $80/kWh and the total storage capex has fallen below $120/kWh for co-located projects with solar and $140/kWh for standalone projects. These price and performance levels are on par with those currently available in China and significantly below those in the United States (US) or the European Union (EU). It appears that India seems to have replicated the success of low-cost solar with battery storage as well, at least on paper. The competitiveness of solar+storage is further corroborated by recent project announcements, such as the $6 billion, 5 GW/19 GWh solar+storage project in Abu Dhabi (ESS News, 2025). Set to be commissioned in 2026, the project is the largest of its kind to date and will provide clean baseload power around the clock.
The storage costs reflected by the latest auction prices in India have profound implications for the costs of a flat block of power – i.e., a solar+storage system can supply a steady stream of power with high availability throughout the year, given the cost-competitiveness of current solar prices
We next run an optimization to maximize the flat block load that can be procured from the given solar and storage costs along with a site-specific 8760 hourly profile. The optimization incorporates an hourly balancing that accounts for hourly solar generation, storage charging/discharging, possible curtailment (including both that can possibly be resold to the grid and also any excess/waste above the PV AC capacity), and possible shortfall during which backup would be required. We constrain annual solar + storage generation to a minimum 95% capacity factor, ensuring, in other words, at most 5% backup. To calculate the costs of the different backup options – grid or diesel – we use the latest India-specific costs.
In Figure 6, we compare the LCOE of a solar+storage system with 95% availability (no backup), an on-grid solar+storage system with 100% availability (using 5% grid backup and with surplus electricity sold to the grid), and off-grid solar+storage system with 100% availability (using 5% diesel backup and surplus electricity curtailed). We find that a solar+storage system with 95% availability costs $54/MWh or 4.5 INR/kWh today. If a grid connection is available, grid backup can be purchased to increase the system capacity factor to 100%, while surplus electricity can be sold to the grid in times of excess, leading to a marginally higher LCOE of $56/MWh or 4.7 INR/kWh. Both options are under 5 INR/kWh, competitive with new coal-fired power plants at the point of injection (i.e., not accounting for inertial and other ancillary services). If a grid connection is not available, and diesel backup is used instead, the LCOE is at $74/MWh or 6.2 INR/kWh. Notably, these availabilities are higher than the average coal availability in India of ~85%, which in some states is even lower; therefore, these numbers can be seen as conservative estimates, as the flat block adder to match the normative coal availability would be lower.
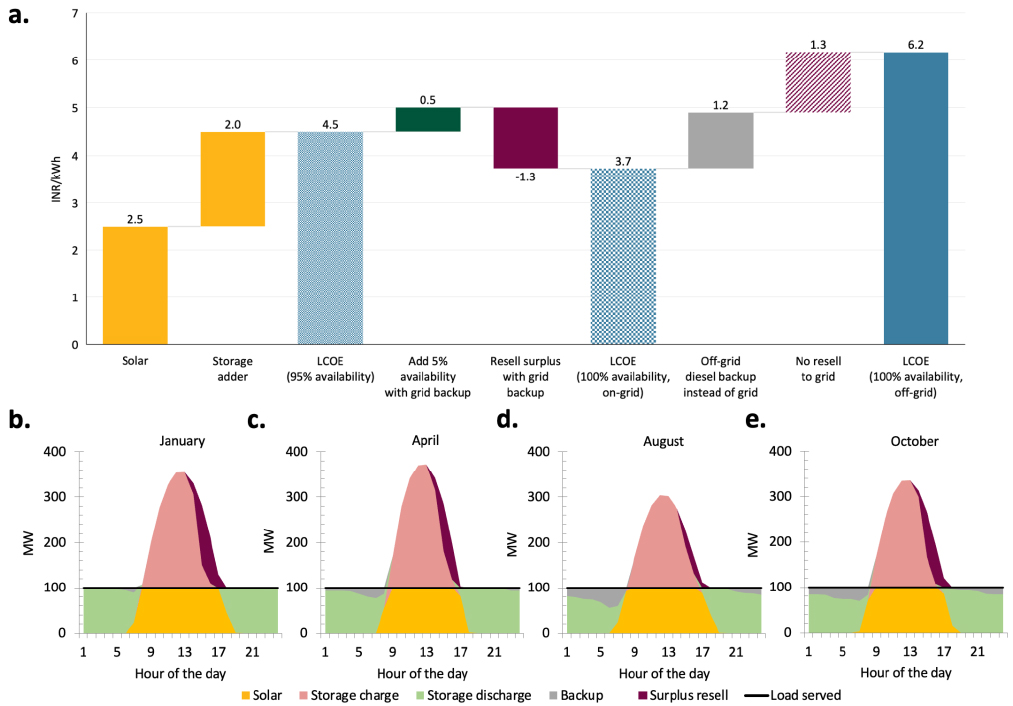
Figure 6. (a) The build-up of the LCOE of a solar+storage system by availability (expressed in capacity factor), grid connectivity and backup type. Monthly average operating profiles for (b) January, (c) April, (d) August, and (e) October. Relative to the first part of the year, more backup is needed in August & October to support seasonal variability. Site-specific results for a site near existing solar generators in Rajasthan; for the full details, see the Methods.
We also compare when backup would be needed to ensure 100% availability to hourly prices on the IEX in 2024. As seen in the heat map in Figure 7a, backup would be required mostly on occasional mornings in the second half of the year, following low-solar days in which storage was not able to fully charge to supply load. However, as Figure 7b shows, the highest power prices occur mostly during morning and evening peaks in the first few months of the year.

Figure 7. (a) A 95% solar+storage system would predominantly require backup on early winter mornings, while (b) high power prices – signifying the use of expensive gas generators – are typically observed during afternoon and evening peaks (based on 2024 IEX prices).
With solar+storage capable of supplying a 24/7 flat block of clean power at less than 6 INR/kWh – and its competitiveness likely to improve further in the coming years – this has profound implications for applications such as new coal-fired power plants, captive power plants, or key industrial loads. First, it undermines the case for new coal, since a solar+storage flat block offers competitive and predictable pricing – and coal is unlikely to match the declining cost trajectory of clean energy technology. Solar+storage systems are also modular and can be scaled easily, in contrast to coal-fired power plants that are typically on a GW-scale and with correspondingly high capital costs. Other analyses have similarly shown that the cost of solar+storage is not only already lower and therefore competitive with new coal-fired power plants in India, but also set to decline faster (IEA, 2024c; Rodrigues and Khan, 2024). Further, India has ~200 GWh of battery manufacturing capacity underway, with the majority of this capacity dedicated to the automotive industry over grid storage, suggesting there is ample manufacturing capacity to support the development of solar+storage flat block systems.
This is also a major development for consumers which require a steady supply of electricity, mostly industrial and commercial consumers like metal processing facilities, data centers for artificial intelligence (AI), and the like. As a baseline, as of FY2025 across all Indian states, industrial electricity prices average 7900 INR/MWh (Kareer, 2024). In Figure 8, we compare the historical national industrial electricity prices with the projected national industrial electricity prices based on the historical increase between 2010 and 2025. Industrial electricity prices are set to continue to increase in the coming years, whereas the falling capital costs of a solar+storage flat block are projected to offset price increases resulting from inflation. This indicates that a solar+storage flat block can offer an inflation-proof supply of low-cost, carbon-free electricity and should be further evaluated by industrial consumers across India.
Figure 8. Costs of a solar+storage flat block are projected to remain constant through 2040 in nominal terms, whereas national electricity prices for industrial consumers are likely to increase based on historical trends (Kareer, 2024). A solar+storage flat block is also competitive with industrial electricity prices in several major Indian states, which have exhibited significant variability over the past fifteen years.
While it should be noted that industrial electricity prices vary significantly by state (i.e. industrial tariffs in Bihar, the most expensive state, are over twice that of Gujarat, the least expensive state), all states have seen at least a slight increase in industrial tariffs over the past fifteen years in nominal terms. Even when up to 1 INR/kWh is added for transmission tariffs, a solar+storage flat block remains substantially lower-cost than the existing industrial rates in India today. Further analysis is planned to explore the state-level costs of a solar+storage flat block based on local load curves, industrial electricity tariffs and transmission charges. This is particularly relevant considering the analysis was based on a site in Rajasthan, given recent bids’ specifications that storage can be sited PAN India, although this may change with increasing solar penetration in Rajasthan and corresponding transmission bottlenecks to deliver that power to the rest of India (Mallya et al. 2024).
Future work should explore sensitivities with varying solar profiles based on location in India as well as enhance the robustness of results under different climate futures and potentially changing solar insolation levels. An upcoming study will also include detailed power system modeling to show how energy storage can contribute to India’s electricity supply through 2032.
To calculate the Levelized Cost of Storage (LCOS), we assume that the total battery capex is composed of the battery pack cost, pack replacement cost, Electrical and Structural BOS (Balance of System), and the EPC (Engineering, Procurement and Construction). Battery pack prices are based on global values from (BNEF, 2024) while BoS and EPC values are based on (NREL, 2024) and updated to reflect 2024 US$. We assume a 12-year project life and 95% availability for standalone; and a 25-year project life and 100% availability for co-located solar+storage, based on specifications in recent auctions. We also assume an opex of $1.1/kWh/yr (101 INR/kWh/yr) and a real WACC of 10%. Pack replacement refers to the discounted net present value (NPV) of a pack replacement in the 12th year (~2039) for co-located systems. Throughout the analysis, we use an exchange rate of 84 INR =1 USD. The LCOS is then calculated by:

with ηRT referring to the round trip efficiency.
We run an optimization to maximize the flat block load that can be procured from the given solar and storage costs – i.e., a solar LCOE of 2.5 INR/kWh and a estimated flat block storage adder of 2 INR/kWh – along with a site-specific 8760 hourly profile. The optimization incorporates an hourly balancing that accounts for hourly solar generation, storage charging/discharging, possible curtailment (including both that can possibly be resold to the grid and also any excess/waste above the PV AC capacity), and possible shortfall during which backup would be required. We constrain annual solar + storage generation to a minimum 95% capacity factor, ensuring, in other words, at most 5% backup. To estimate the costs of grid backup and/or the revenue that can be generated from selling surplus electricity to the grid, we use hourly prices from the IEX in 2024. To calculate the costs of diesel backup, we use the latest India-specific cost of 90 INR/L. For the solar profile, we take a site near Phalodi, Rajasthan – close to several existing solar farms – from (Pfenninger and Staffell, 2016).
(BNEF, 2024). “Lithium-ion Battery Price Survey, 2024”. Bloomberg New Energy Finance (BNEF), 2024.
(IEA, 2024a). “Energy Technology Perspectives 2024”. International Energy Agency (IEA), 2024. https://www.iea.org/reports/energy-technology-perspectives-2024
(IEA, 2024b). “Advancing Clean Technology Manufacturing An Energy Technology Perspectives Special Report”. International Energy Agency (IEA), 2024. https://www.iea.org/reports/advancing-clean-technology-manufacturing
(IEA, 2024c). “Batteries and Secure Energy Transitions”. International Energy Agency (IEA), 2024. https://www.iea.org/reports/batteries-and-secure-energy-transitions
(IRENA et al., 2024). IRENA, “Renewable Power Generation Costs”; Nemet, “Interim monitoring of cost dynamics for publicly supported energy technologies”; Farmer and Lafond, “How predictable is technological progress?” – with major processing by Our World in Data. Retrieved February 18, 2025 from https://ourworldindata.org/grapher/solar-pv-prices
(Kareer, 2024). K. Kareer. “India Retail Power Tariff Update: FY 2025”. Bloomberg New Energy Finance (BNEF), 2024.
(Mallya et al. 2024). H. Mallya, D. Yadav, A. Maheshwari, N. Bassi, P. Prabhakar. “Unlocking India’s RE and Green Hydrogen Potential”. CEEW, 2024. https://www.ceew.in/sites/default/files/renewable-energy-green-hydrogen-lands-water-nexus-in-india.pdf
(Narang et al., 2024). P. Narang, S. M. Deorah, A. Phadke. “Comparing solar costs & deployment in India and the United States”. India Energy and Climate Center (IECC), UC Berkeley, 2024. https://iecc.gspp.berkeley.edu/resources/visualizations/comparing-solar-costs-deployment-in-india-and-the-united-states/
(NREL, 2024). “Annual Technology Baseline: Utility-Scale Battery Storage”. NREL, 2024. https://atb.nrel.gov/electricity/2024/utility-scale_battery_storage
(O’Dea, 2025). B. O’Dea. “Masdar, EWEC announce 5 GW/19 GWh solar-plus-storage project in Abu Dhabi”. ESS News, 2025. https://www.ess-news.com/2025/01/14/masdar-ewec-announce-5-gw-19-gwh-solar-plus-storage-project-in-abu-dhabi/
(Pfenninger and Staffell, 2016). S. Pfenninger and I. Staffell. “Long-term patterns of European PV output using 30 years of validated hourly reanalysis and satellite data”. Energy 114, pp. 1251-1265. https://dx.doi.org/10.1016/j.energy.2016.08.060
(Ridden, 2024). P. Ridden. “World first energy storage unit demonstrates zero degradation over 5 years”. New Atlas, 2024. https://newatlas.com/energy/catl-tener-energy-storage-system
(Rodrigues and Khan, 2024). N. Rodrigues and N. Khan. “Drivers to Coal Phase-Down in India: Part 1 – Battery Cost Declines”. Ember, 2024. https://ember-energy.org/latest-insights/drivers-to-coal-phase-down-in-india/
(Zhang, 2024). P. Zhang. “CATL launches Tener energy storage system with 5-year 0-attenuation”. CNEV Post, 2024. https://www.catl.com/en/news/6232.html