* Corresponding author – email
1 India Energy & Climate Center, University of California, Berkeley
2 Power Foundation of India, a Think Tank and Society under the aegis of Ministry of Power, GoI
India’s electricity demand is witnessing a rapid surge, nearly doubling every decade, fueled by strong economic growth.
Dramatic cost reductions over the last decade for wind, solar, and battery storage technologies position India to leapfrog to a more flexible, robust, and sustainable power system for delivering affordable and reliable power to serve the growing power needs. India has also set ambitious clean energy targets – aiming to install at least 500 GW of non-fossil based power generation capacity by 2030. Additionally, Renewable Purchase Obligations (RPOs) at the national and state levels require electric utilities to source at least 43% of their energy from renewable sources, including large hydro by 2030. As India’s grid attains higher penetrations of renewables, balancing generation variability through a spectrum of flexible resources, particularly energy storage, becomes increasingly important for ensuring the affordability, stability, and reliability of grid power. India has already set a national target for energy storage, aiming to meet 4% of its electricity demand by 2030, which translates to approximately 200-250 GWh of grid-scale storage capacity.
In this context, the dramatic decline in energy storage costs—marked by a nearly 90% reduction in global storage prices over the last decade and recent energy storage auctions in India reflecting a 65% cost reduction since 2021—could be a pivotal moment. This cost reduction enables the cost-effective supply of low-cost renewable electricity during peak demand periods, addressing key limitations of renewable energy (RE). Furthermore, with a substantial portion of India’s electricity grid infrastructure yet to be built, these cost declines present a unique opportunity for India to leapfrog to a more flexible, resilient, and sustainable power system, positioning it as a global leader in clean energy innovation.
The objective of this study is to assess:
The study uses the latest RE and storage cost data, an industry-standard power system modeling platform (PLEXOS), and exhaustive analytical methods (optimal capacity expansion and power plant-level hourly grid dispatch simulations)
In the “Reference Case” scenario, which assumes utilities comply with the current state and national Renewable Purchase Obligations (RPO) and energy storage targets, India’s total non-fossil capacity is projected to exceed 500 GW by 2030 and reach approximately 600 GW by 2032 (as shown in Figure 1). By 2030, a total renewable energy capacity (excluding large hydro) of 456 GW is identified as cost-effective, comprising 315 GW of solar, 119 GW of onshore wind, 7 GW of offshore wind, and 15 GW from small hydro and biomass. By 2032, this renewable energy capacity is expected to grow to 524 GW, with solar accounting for 372 GW, onshore wind for 122 GW, offshore wind for 15 GW, and small hydro and biomass contributing 15 GW.
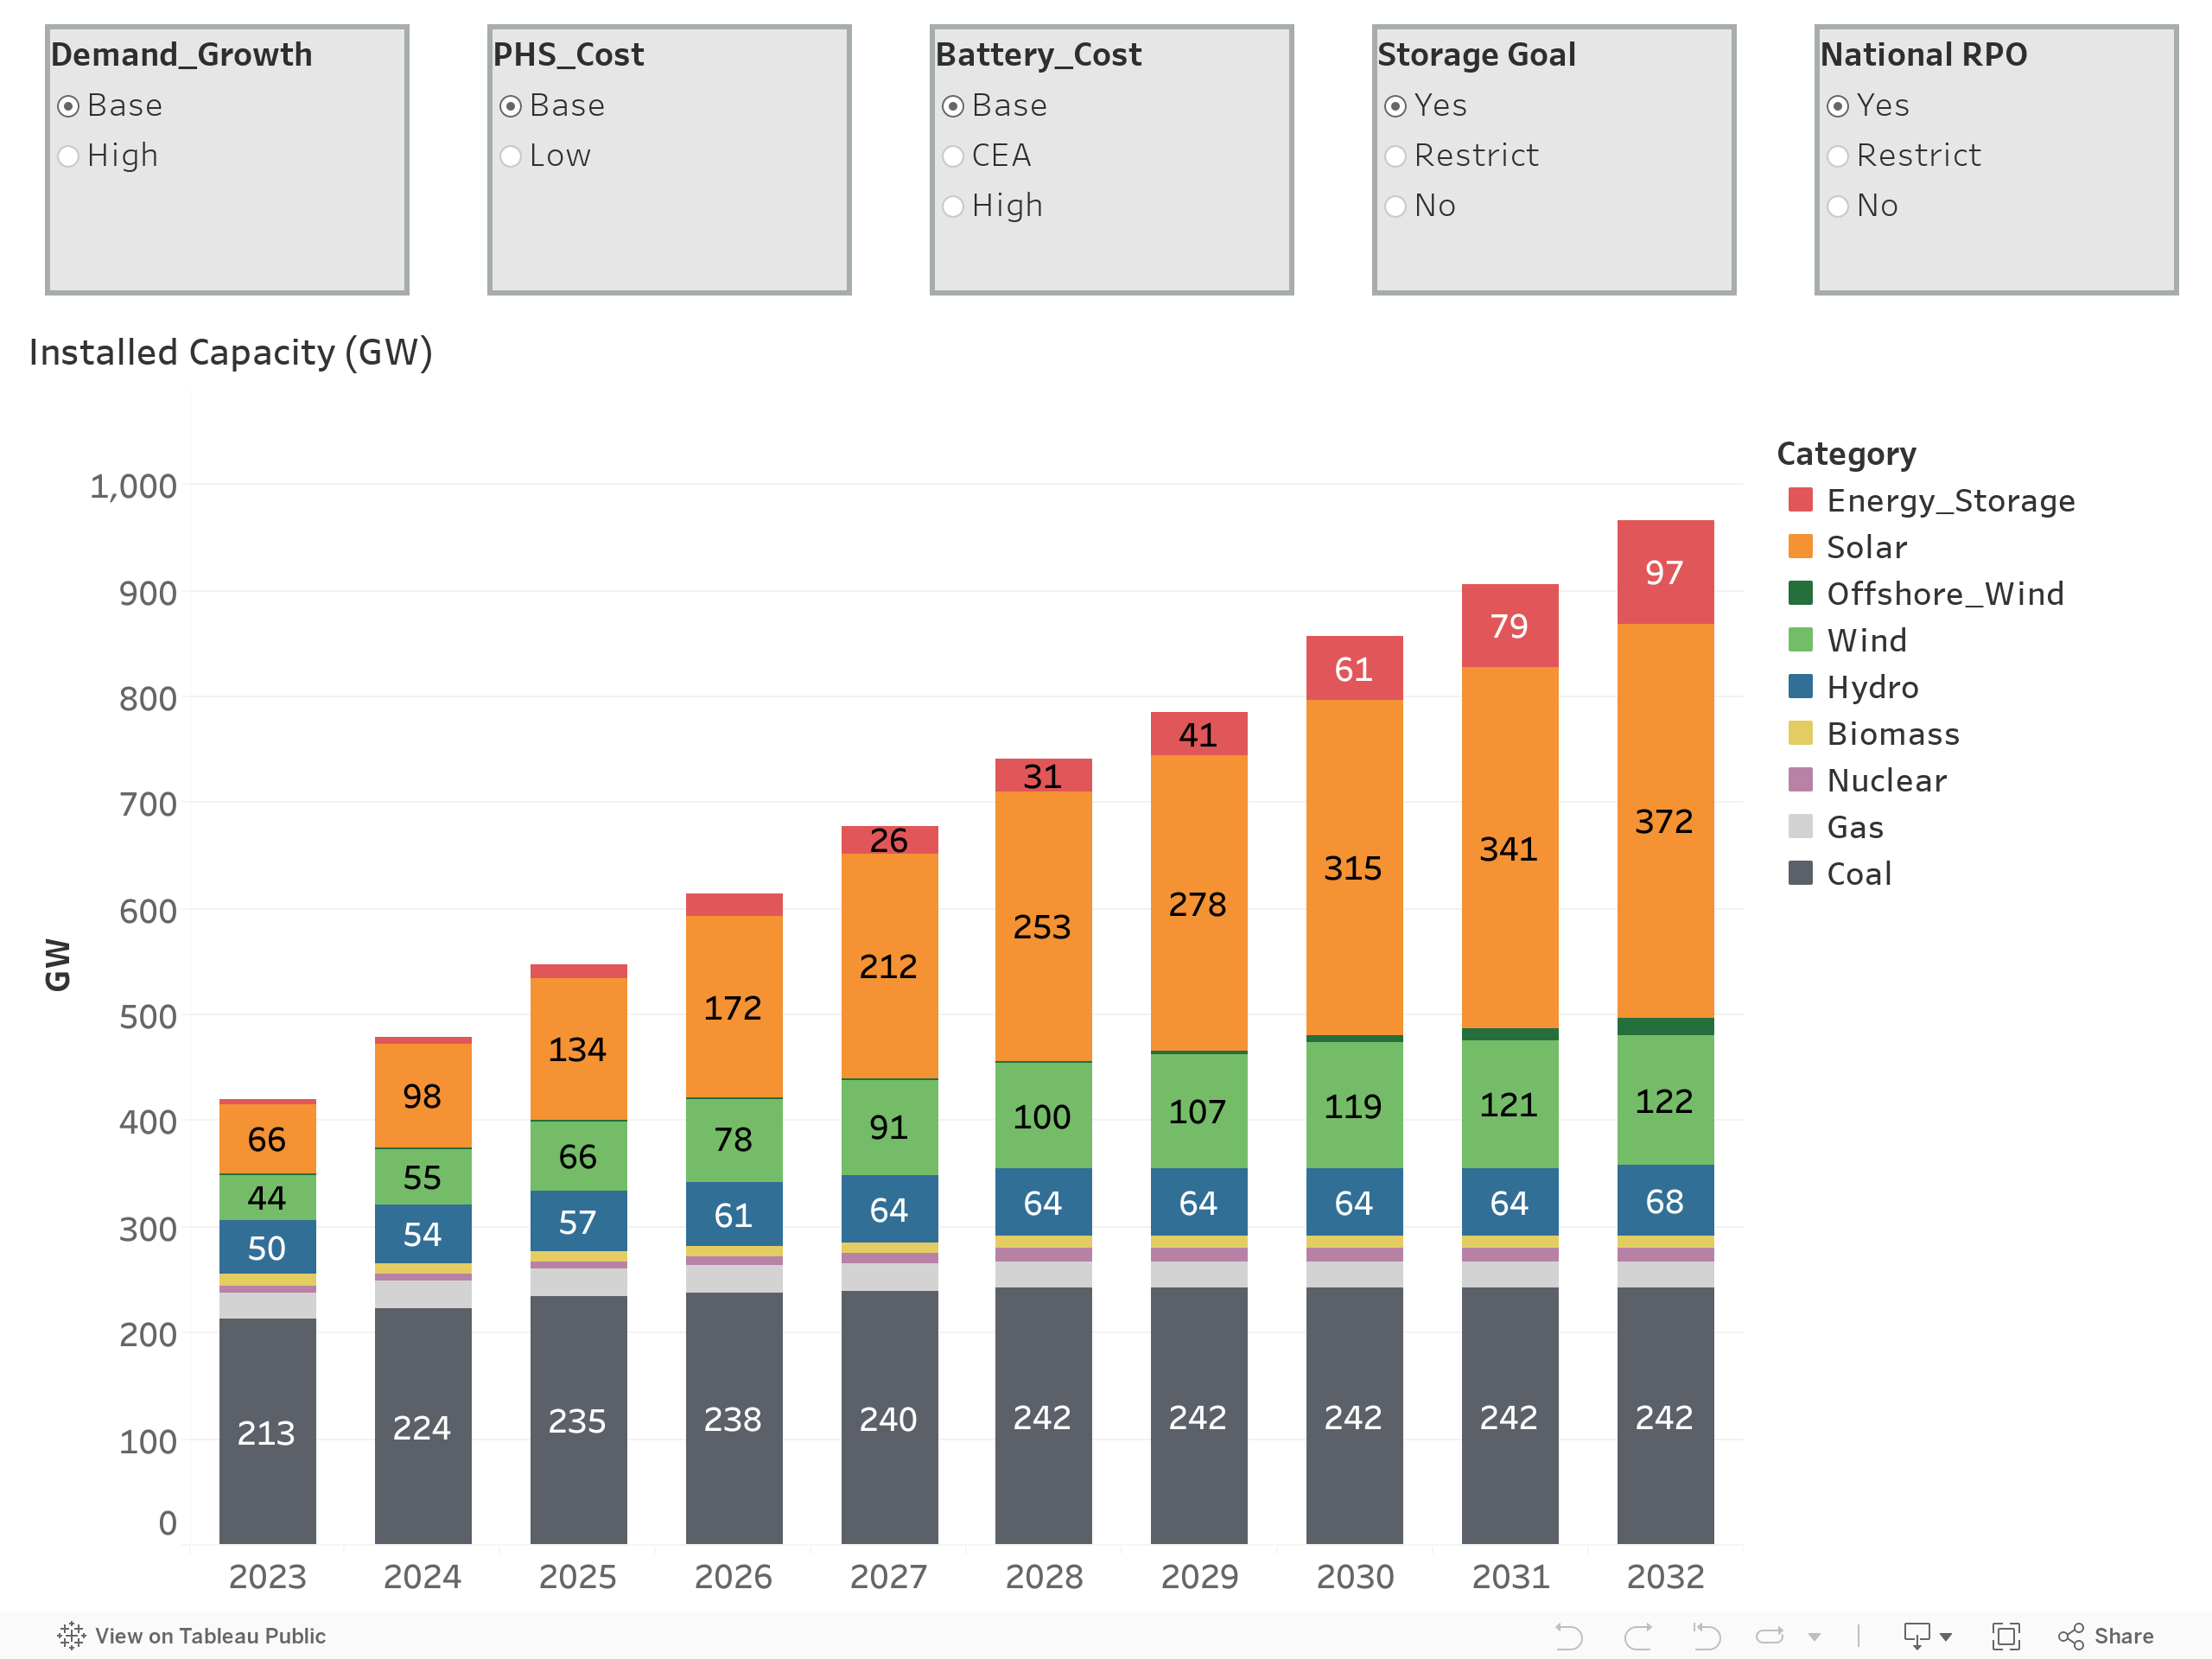
Figure 1. Installed Capacity in the “Reference Case” scenario that assumes utilities comply with the current state and national Renewable Purchase Obligations (RPO) and energy storage targets
By FY 2030, approximately 61 GW / 218 GWh of energy storage is found to be cost-effective to support RE deployment, aligning with India’s national storage targets. As electricity demand and RE capacity expand, this storage requirement is expected to grow to 97 GW / 362 GWh by FY 2032.
This represents substantial growth from India’s current energy storage capacity of approximately 6 GW (mostly pumped hydro), underscoring the need for robust policy and regulatory support to accelerate storage deployment at this scale.
The modeling study takes into account the 27 GW of new coal capacity currently under construction, slated for commissioning by 2030. However, apart from this under-construction capacity, no additional coal capacity is found to be cost-effective by 2030. The total cost-effective coal capacity by 2030 is projected to be 242 GW.
The non-fossil share of total electricity generation is expected to more than double between 2023 and 2030, increasing from 26% in 2023 (including large hydro and nuclear) to 58% by 2030, and reaching 60% by 2032. Despite nearly doubling electricity demand, thermal generation remains relatively stable, ranging between 950-1,000 TWh per year (ex-bus). In contrast, renewable energy generation (excluding large hydro) is projected to increase substantially, rising from 210 TWh in 2023 (13% of total generation) to 1,025 TWh by 2030 (44% of total generation), and further to 1,195 TWh by 2032 (47% of total generation).
The average power procurement cost, factoring in both fixed and variable costs of existing and new capacity as well as bulk transmission, is projected to decline slightly in real terms, from the historical level of Rs. 5.46/kWh to Rs 5.41/kWh by 2030 and further to Rs 5.37/ kWh by 2032, despite significant clean energy expansion.
Remarkably, even without RPO or the national storage target, the least-cost resource mix for FY 2030 still consists of 504 GW of non-fossil capacity. This includes 303 GW of solar, 105 GW of onshore wind, 7 GW of offshore wind, 15 GW of biomass and small hydro, and 59 GW of large hydro, and 14 GW of nuclear. Additionally, the economical energy storage requirement is found to be approximately 51 GW, comprising 42 GW of battery storage and 9 GW of pumped hydro. By 2032, cost-effective non-fossil capacity is projected to increase to 590 GW, including 372 GW of solar, 105 GW of onshore wind, and 16 GW of offshore wind, supported by 86 GW of storage. Optimal coal capacity by 2030 is found to be 244 GW, implying only 2 GW of additional coal capacity beyond the 27 GW already under construction. By 2030, the average power procurement cost is expected to reduce slightly by 2% in real terms, to Rs. 5.35/kWh.
Table 1 summarizes the key scenario results.
Table 1. Installed capacities, average power procurement costs, and share of non-fossil resources in total electricity generation (2023 and 2030)
| Property | Technology | Actual (2023) | Reference Case (2030) | No RPO and Storage Targets (2030) | High Battery Cost (2030) | Low PHS Cost (2030) | Restricted Storage Deployment (2030) |
|---|---|---|---|---|---|---|---|
| Installed Capacity (GW) | Coal | 213 | 242 | 244 | 242 | 242 | 270 |
| Natural gas | 25 | 25 | 25 | 25 | 25 | 25 | |
| Nuclear | 7 | 14 | 14 | 14 | 14 | 14 | |
| Hydro (incl Small Hydro) | 50 | 64 | 64 | 64 | 64 | 64 | |
| Wind | 44 | 126 | 112 | 127 | 126 | 127 | |
| Solar | 66 | 315 | 303 | 315 | 316 | 311 | |
| Biomass | 10 | 10 | 10 | 10 | 10 | 10 | |
| BESS | 0 | 51 | 41 | 41 | 42 | 10 | |
| Pumped Hydro | 5 | 9 | 9 | 18 | 17 | 11 | |
| Total | 420 | 856 | 823 | 856 | 856 | 842 | |
| Average Power Procurement Cost (Rs/kWh) | 5.46* | 5.37 | 5.35 | 5.48 | 5.36 | 5.59 | |
| Share of non-fossil resources in total electricity generation (%) | 26% | 58% | 55% | 58% | 58% | 57% |
* model estimate.
The key drivers of these results are the inflation-resistant, low-cost nature of renewable energy and energy storage. Energy storage eliminates the need for additional thermal capacity to meet morning and evening peak demands, while agricultural and industrial load shifting from evening to solar hours significantly reduces nighttime load, thereby minimizing the requirement for new baseload coal-fired capacity.
By 2030, a total of 61 GW/218 GWh of energy storage is projected to be cost-effective to support 500 GW of clean power capacity. This requirement is expected to grow to 97 GW/362 GWh by 2032 (as illustrated in Figure 2).
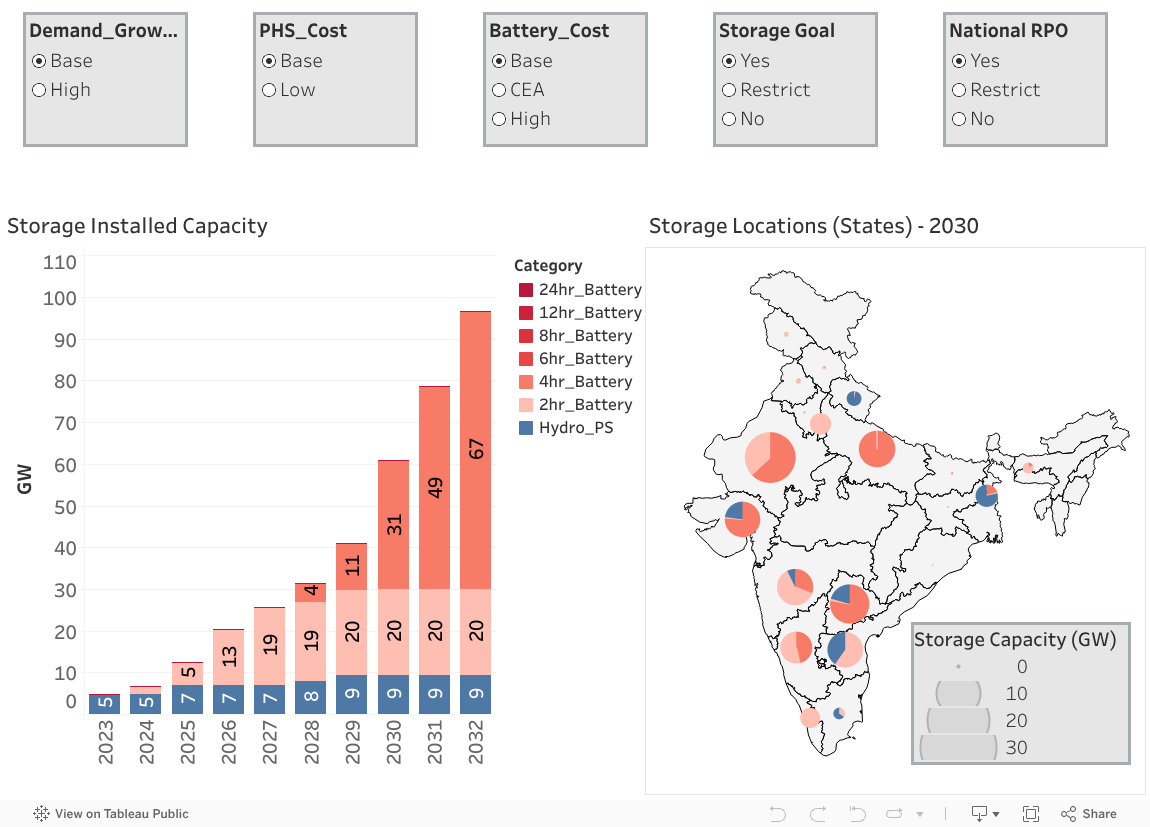
Figure 2. Energy storage installed capacity in the “Reference Case” scenario
Due to the significant reduction in battery costs, battery storage is anticipated to dominate the overall energy storage mix. By 2030, 51 GW/164 GWh of battery storage is found to be cost-effective, comprising 20 GW of 2-hour batteries and 31 GW of 4-hour batteries. By 2032, the storage requirement will rise to approximately 97 GW/362 GWh, with battery storage making up 87 GW/308 GWh—consisting of 67 GW of 4-hour batteries and 20 GW of 2-hour batteries. Additionally, around 9 GW of pumped hydro capacity, including 2.7 GW currently under construction, is found to be economically viable by 2030.
It is important to note that the cost-effectiveness of battery storage versus pumped hydro depends largely on the underlying cost assumptions, with battery storage likely to play a dominant role given recent and expected future cost reductions. However, as shown in figure Figure 3, if battery costs remain high (“High Battery Cost” Case that projects 4-hour BESS capital cost to be Rs 7.8 Cr/MW by 2030 compared with Rs 4.8 Cr/MW in the Reference Case), pumped hydro investments become more economical and their capacity increases significantly to over 18 GW by 2030 and 22 GW by 2032, while the total storage requirement remains almost the same (59 GW/ 232 GWh by 2030 and 94GW/ 380GWh by 2032). While 2-hour battery capacity remains almost the same as the Reference Case (20 GW), 4-hour battery capacity reduces significantly to 21 GW by 2030 and 52 GW by 2032. Similarly, in the “Low PHS Cost” Case, if pumped hydro projects could be developed at low cost (Rs 4.1 Cr/MW vs Rs 6.6 Cr/MW in the Reference Case), their cost-effective capacity would increase to 17 GW by 2030, and battery capacity would drop to 42 GW.

Figure 3. Energy storage installed capacity in the “High Battery Cost” case (left) and “Low PHS Cost” case (right)
However, the regional distribution of energy storage changes significantly. As pumped hydro potential is driven by the geographical location of the project, storage capacity may not necessarily be concentrated in solar-rich states.
Until 2027, 2-hour batteries are expected to dominate the energy storage landscape, primarily providing support during evening peak demand. As demand patterns evolve, 4-hour batteries are projected to take the lead from 2027 onwards, offering extended support for longer periods (Figure 2). By 2027, approximately 21 GW of new storage capacity will be required to prevent evening and nighttime power shortages. After accounting for 2.7 GW of pumped hydro storage (PHS) currently under construction, the analysis finds that around 19 GW of new battery storage capacity—mostly 2-hour batteries, although frequently discharged over 4-6 hours at slower rates—will be the most cost-effective option.
By 2030, the total cost-effective battery storage capacity is projected to be 51 GW/164 GWh, comprising 20 GW of 2-hour batteries and 31 GW of 4-hour batteries. By 2032, the storage requirement is expected to increase to approximately 97 GW/362 GWh, including 87 GW of battery storage. This capacity will be made up of 67 GW of 4-hour batteries and 20 GW of 2-hour batteries. Most of these batteries are anticipated to cycle only once per day, charging primarily during periods of high RE generation during the day and discharging during evening and nighttime peak demand periods. On average, these batteries will complete around 300-350 cycles annually, reflecting their role in daily peak load management.
Battery storage locations are expected to align closely with regions that have significant solar capacity, large load centers, and states with limited peaking capacity, such as Gujarat, Rajasthan, Maharashtra, Uttar Pradesh, Andhra Pradesh, and Telangana (Table 2). In contrast, states with high wind penetration, like Tamil Nadu and Karnataka, are likely to have lower storage value, making battery installations less cost-effective in these regions.
Table 2. Required Energy Storage Capacity in 2030 in Key States in “Reference Case”
| State | 2030 Storage Capacity |
|---|---|
| Rajasthan | 13.0 GW / 43 GWh |
| Gujarat | 6.3 GW / 28 GWh |
| Telangana | 7.8 GW / 34 GWh |
| Uttar Pradesh | 6.7 GW / 27 GWh |
| Andhra Pradesh | 3.8 GW / 23 GWh |
| Maharashtra | 6.6 GW / 19 GWh |
| Karnataka | 5.1 GW / 15 GWh |
| Other States | 11.7 GW / 29 GWh |
| All-India | 61 GW / 218 GWh |
Additionally, some energy storage will be needed in the North-Eastern region to integrate local solar generation and reduce the need for new transmission infrastructure. Co-locating batteries with solar power plants offers a substantial cost-saving opportunity, reducing capital costs by 15-20% due to shared Balance of System (BOS) components. Batteries and solar can share inverters, other power electronics, and grid interconnections, streamlining infrastructure costs. Moreover, solar power (DC) can charge batteries directly without the need for a converter, increasing their roundtrip efficiency as well as increasing the capacity utilization of the transmission infrastructure. In contrast, pumped hydro storage does not benefit from co-location with renewable energy in this manner. Moreover, pumped hydro projects will be highly site/location dependent.
Existing and under-construction thermal power plants combined with hydropower, nuclear, and energy storage capacity enable India to meet electricity demand dependably—in every hour of the year in each state—with 456 GW of installed RE capacity in 2030 and 524 GW in 2032 (excluding large hydro). India’s RE generation, particularly wind generation, is highly seasonal. Energy storage helps to maintain grid dependability throughout the year, including times of high system stress such as periods with peak annual load, high RE variability, and high net load.
On most days, energy storage typically charges during the day and discharges during evening and morning peak hours (4 hours/day) as shown in Figures 4 and 5. Agricultural load shift offers significant night time load reduction potential. Energy storage provides the critical arbitrage service by charging during high RE generation / low electricity price periods and discharging during peak / high electricity price periods. In winter (December-January), due to low night time and early morning demand and excess wind generation at night due to reverse monsoon, some storage capacity also charges during early morning to be discharged during the morning peak hours. Storage would be a critical source of flexibility starting as early as 2024, especially in states with high solar penetration such as Rajasthan, Gujarat etc
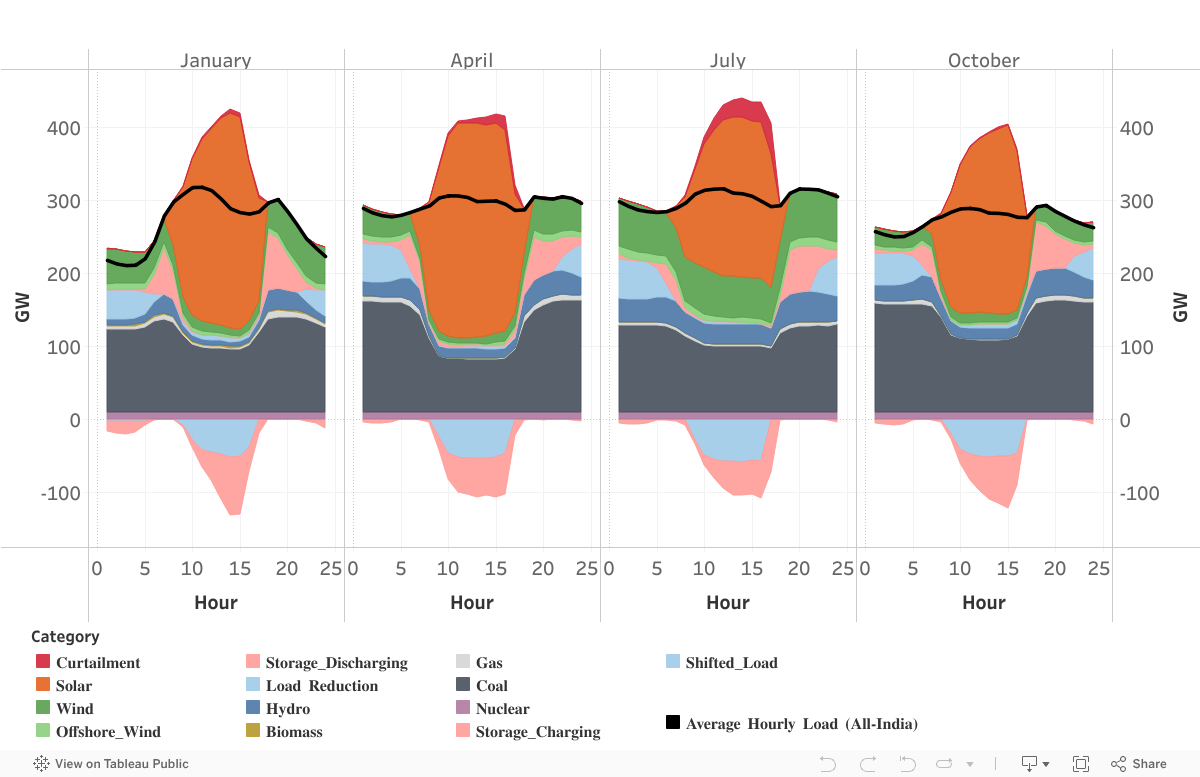
Figure 4. All-India average hourly dispatch in key months in 2032 in the “Reference Case” scenario
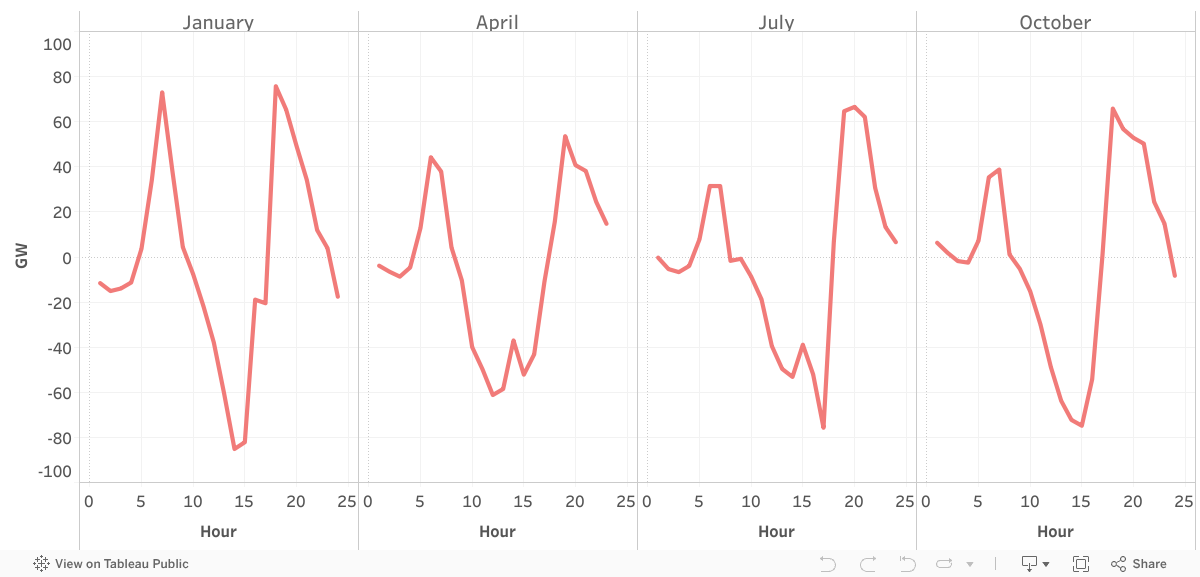
Figure 5. All-India average net hourly storage output in key months in 2032 in the “Reference Case” scenario Storage capacity = 97 GW/318 GWh. Positive storage output indicates discharge, while negative indicates charging.
Coal power plants continue to provide base load support; however, by 2032, approximately 120 GW of coal capacity will operate with a gross capacity factor above 60%, while more than 70 GW of coal capacity is expected to function at less than 30% capacity factor. This suggests that a significant portion of coal capacity will likely be utilized primarily during peak demand seasons, serving as seasonal balancing. Although no new gas power plants are found to be cost-effective, existing gas capacity offers limited seasonal balancing support during the low renewable energy season (October to February). However, its availability is heavily constrained due to the shortage of low-cost domestic gas.
About 2.7% of RE curtailment is found to be necessary for reliable grid integration, mostly during monsoon due to significant increase in wind generation and reduction in load in the western and southern states.
Renewable energy introduces significant variability into the system, particularly with “up” and “down” ramps during sunrise and sunset due to sudden increases or drops in solar generation. However, the system can manage this variability with the aid of energy storage and limited curtailment (~2.7%).

Figure 6. Hourly load, net-load, and storage ramp duration curves in FY 2032 in the “Reference Case” scenario. The chart shows the hourly ramps for all 8760 hours in FY 2032 sorted in a descending order. Positive ramps indicate “up” ramps, while negative ramps indicate “down” ramps.
Maximum net load ramps by FY 2032 could be as high as 160 GW/hr (net additional “up” ramps due to RE as high as 110-120 GW/hr by 2032, on top of load-only ramps). These ramps could be met by storage (providing ~110 GW/hr of “up” ramps), along with other resources including thermal and hydro. “Down” ramps become particularly problematic especially when thermal capacity is operating at technical minimum levels. However, storage is found to be able to handle such ramps as well, by providing additional down ramps of -65 GW/hr, against the maximum need of -85 GW/hr.
If energy storage deployment lags, India may need to build significant new coal resources primarily as a firm capacity resource, even if the country achieves the 500 GW clean power target by 2030 (and ~600 GW clean power by 2032). If energy storage cannot be deployed fast enough (“Restrict” case), storage capacity may be restricted to 21 GW by 2030 and 29 GW by 2032, and about 57 GW of new thermal capacity would be needed by 2030 and 80 GW by 2032 (both numbers including 27 GW under construction coal capacity), implying total coal capacity will be 270 GW by 2030 and 294 GW by 2032, even if utilities meet their RPO targets. However, such a coal buildout—in tandem with the RE buildout—would likely cause the average fleet-level coal capacity factor to drop to 43% (gross) by 2030 and 41% by 2032, with nearly 125 GW of coal capacity (mostly existing plants with high variable cost) operating at capacity factors of under 30%. This result could put such assetsat increased risk of being stranded and needing regulatory support. Deploying energy storage can prevent the stranding of coal capacity by reducing the new coal buildout while maintaining grid dependability and enabling existing coal assets to operate more efficiently. In the Reference Case, the average fleet-level coal capacity factor could be maintained at 51% (gross) in 2032, still significantly lower than about 64% in 2023. Moreover, only 70 GW of coal capacity with high variable costs may still operate at capacity factors below 30%.
Recent battery storage auctions in India have received an overwhelmingly positive response, with energy storage prices falling by nearly 65% in a span of three years. Figure 7 shows the estimated battery storage capital cost in India in $/kWh, as discovered through reverse auctions over years. SECI conducted 1200 MW solar + co-located 600 MW/1200 MWh battery storage auctions in July 2024. The winning bid was ₹3.41/kWh, which indicates a dramatic reduction in battery storage cost. Assuming a solar LCOE of ₹2.6/kWh, this implies an evening peak storage adder of ₹0.81/kWh. This implies a battery storage capital cost of $150/kWh. Co-location of batteries with solar offers significant BOS cost savings, reducing the overall capital cost by ~20%. Pumped hydro projects, especially off-river plants, have also seen significant cost reduction over years, with recent pumped hydro auctions in Maharashtra revealing a levelized cost of storage of Rs 3.2/kWh for 1000 MW pumped hydro projects with a greenshoe option up to 3000 MW.
Figure 7. Estimated battery storage capital cost split into key components
Batteries are energy (MWh) constrained, while pumped hydro resources are power (MW) constrained. For low storage hours, batteries are cheaper. For up to 6-8 hours/day of storage, battery storage is more economical (already economical up to 5-6 hours/day). By 2030, we find that India will need 4-6 hours of energy storage to integrate 500 GW of clean power (along with ~240 GW of thermal). If pumped hydro projects could be developed in a time-bound manner under Rs. 4 Cr/MW, they should be encouraged.
Declining material costs and an overcapacity in battery manufacturing are driving a substantial reduction in storage costs. As of 2024, the global battery production capacity has reached over 5,000 GWh per year, with more than 80% of this capacity concentrated in China. This supply level is nearly four times the current global demand of 1,200 GWh per year, including electric vehicles.
Battery manufacturing capacity is expected to nearly double to over 9,000 GWh by 2026, with China maintaining approximately 65% of the market share. By 2030, even with a significant rise in battery demand, production overcapacity is projected to persist, with capacity estimated to reach 200% of projected demand. This sustained overcapacity suggests that downward trends in battery costs are likely to continue through 2030. Although battery supply chains are a concern in India, the power sector is unlikely to strain them, as electric vehicle (EV) demand is approximately 10 times greater than that of stationary storage. Major Indian automakers, such as Tata and Mahindra, are actively securing battery supply chains.
Additionally, over 200 GWh of battery manufacturing capacity is planned by 2030 by several major Indian companies including Amara Raja, Ola Electric, JSW Group, Exide, Reliance Industries, Adani Group etc.
India’s energy storage framework incorporates several key policies to drive early adoption and growth. The Ministry of Power’s Energy Storage Obligations (ESO) require utilities to progressively increase storage to 4% of electricity demand by 2030 (equivalent to 200–250 GWh), a critical step for grid stability as renewable capacity expands. The Viability Gap Funding (VGF) scheme offers up to 40% capital cost support for battery energy storage systems (BESS), with a target of 4,000 MWh by 2030. Additionally, transmission charge waivers for storage projects commissioned by 2025 lower project costs, and the Production-Linked Incentive (PLI) scheme promotes domestic manufacturing of advanced battery technologies. Both central and state regulators have established clear tariff structures, compensating storage for services such as energy arbitrage and ancillary support. Key recommendations to strengthen this framework and accelerate deployment include:

